
How to Analyze CSV Data with AI: Step-by-Step Guide
Learn how to analyze CSV data with AI using a practical workflow for summaries, trends, statistics, charts, privacy checks, and follow-up questions.
Ashesh Dhakal
Published May 9, 2026 · Updated May 9, 2026
CSV is still the most common format for quick analysis. Marketing exports, sales reports, survey results, product data, finance records, support tickets, and analytics downloads all tend to arrive as CSV files. The hard part is not opening the file. The hard part is deciding what to ask, which statistics matter, which rows are unusual, and which chart makes the pattern obvious.
This guide shows a practical workflow for using AI to analyze CSV data without writing Python, formulas, or SQL. It is written for people who already have a CSV file and want a useful answer quickly. For the broader tool workflow, start with AnalyzeData to analyze CSV with AI; this article focuses on preparing the file, asking better prompts, validating the answer, and turning the result into a chart or decision.
When AI Helps Most With CSV Analysis
AI is useful when the CSV file is structured but the question is still open-ended. A spreadsheet can show rows and columns, but it will not automatically explain which metric changed, which segment is unusual, or which chart would make the result clear.
Good use cases include:
| CSV task | Useful AI question |
|---|---|
| Sales export | "Which products or regions are driving the most revenue?" |
| Marketing campaign data | "Which campaign has the strongest conversion rate and why?" |
| Survey responses | "Summarize the common patterns and outliers." |
| Support tickets | "Group the most common issue categories." |
| Finance report | "Show the biggest cost changes by month." |
| Product usage events | "Which features have the strongest retention signal?" |
The best first prompt is usually broad: "Analyze this CSV and summarize the important patterns." After that, use narrower follow-up questions. This sequence matters because it lets the AI inspect the data shape before you ask it to make a recommendation.
Prepare The CSV Before Asking AI
A CSV file is simple, but messy CSV files create bad analysis. Before uploading, look for structure problems that can cause the AI to infer the wrong columns or calculate the wrong metric.
| CSV issue | Why it hurts analysis | Fix |
|---|---|---|
| Notes above the header | The AI may treat notes as column names. | Keep the first row as the header row. |
| Blank rows inside the table | Summaries and row counts can be wrong. | Remove blank rows from the data body. |
| Mixed date formats | Time trends may sort incorrectly. | Use one date format such as YYYY-MM-DD. |
| Currency symbols in numeric fields | Numbers may be treated as text. | Use plain numeric values and a separate currency note. |
| Duplicated rows | Totals and averages can be overstated. | Deduplicate rows when duplicates are not meaningful. |
Vague columns such as value | The model has to guess the business meaning. | Rename columns to revenue, cost, score, or another specific label. |
You do not need to clean the file perfectly. You do need one dataset per file, one observation per row, and columns that describe what the values mean.
Step-by-Step CSV Workflow
Start with the raw file. If the CSV has merged headers, duplicated columns, or notes above the actual header row, clean those first. AI works best when each row is one observation and each column has a clear meaning.
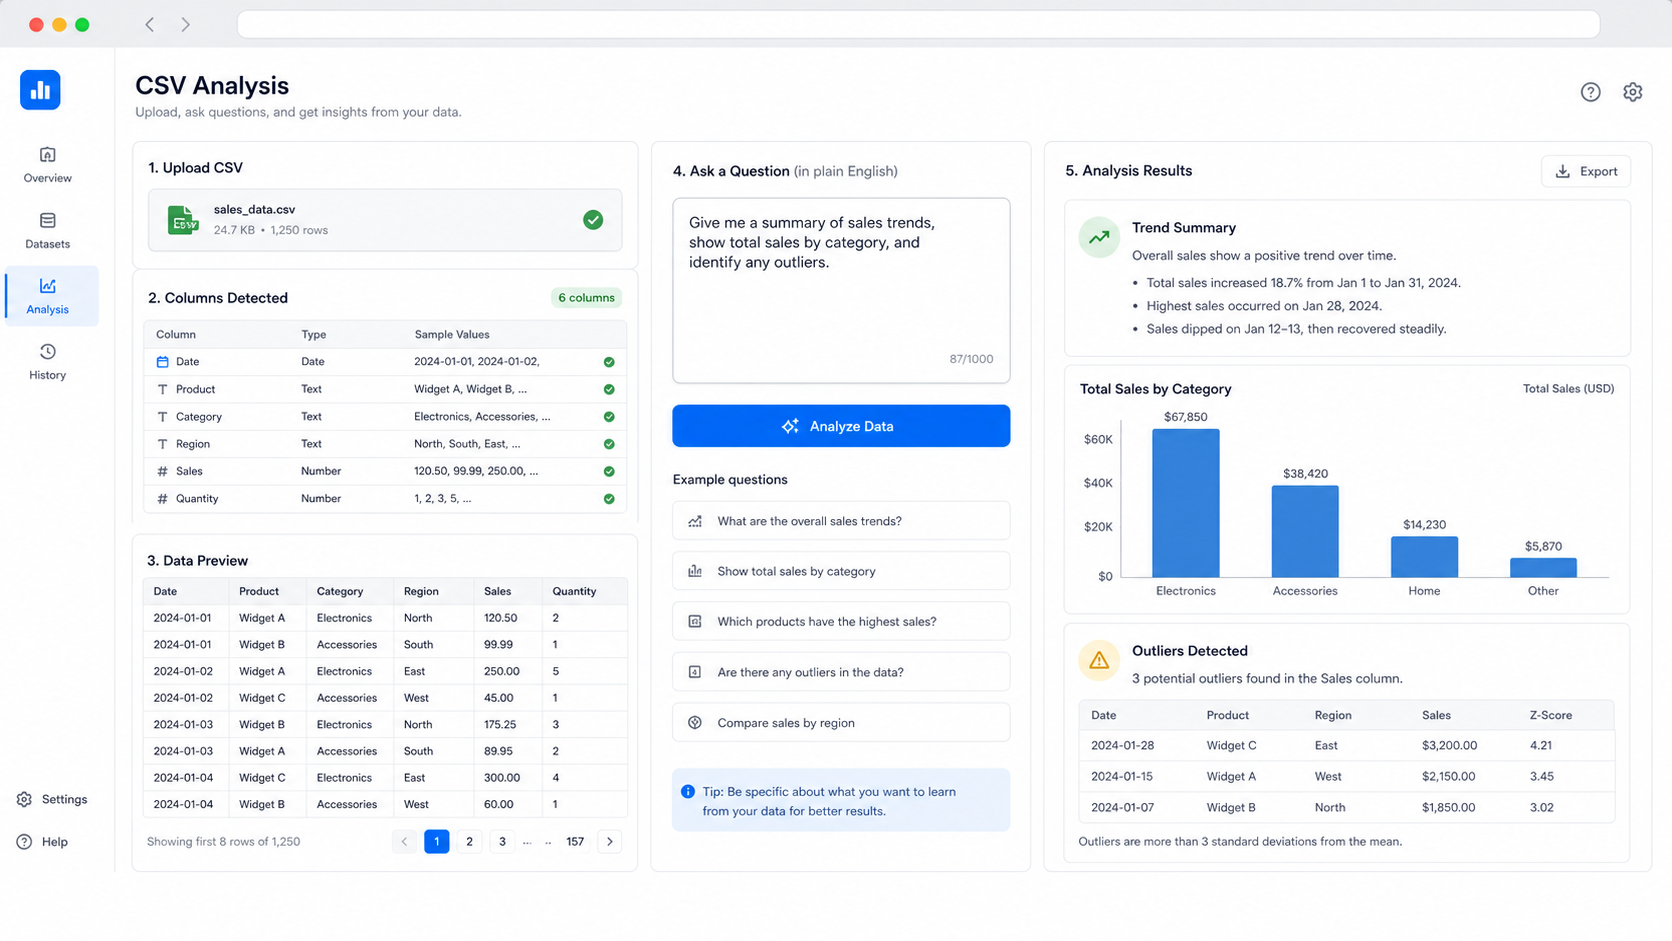
- Open AnalyzeData to analyze CSV with AI and upload your CSV file.
- Ask: "Analyze this CSV and summarize the key trends, outliers, and statistics."
- Review the column interpretation before trusting the answer.
- Ask a focused follow-up, such as "Which segment changed the most?" or "Create a chart showing monthly revenue by channel."
- Validate any important number against the source file.
For a sales CSV, a good first sequence looks like this:
| Step | Prompt | Why it works |
|---|---|---|
| 1 | "Summarize this dataset." | Forces the AI to inspect columns before answering. |
| 2 | "What are the top trends by month?" | Moves from summary to time-based pattern. |
| 3 | "Find outliers by revenue and explain them." | Checks unusual rows before decision-making. |
| 4 | "Create a bar chart of revenue by region." | Turns the finding into a visual. |
| 5 | "List assumptions and checks I should verify." | Makes uncertainty visible. |
This structure helps avoid a common mistake: asking for a final recommendation before the AI has inspected the dataset shape.
Example: Marketing CSV Analysis
Imagine a CSV export with these columns:
| date | channel | campaign | spend | clicks | conversions | revenue |
|---|---|---|---|---|---|---|
| 2026-04-01 | Search | Brand | 420 | 910 | 82 | 6200 |
| 2026-04-01 | Social | Retargeting | 310 | 740 | 31 | 2200 |
| 2026-04-01 | Spring Promo | 90 | 430 | 44 | 3900 |
A useful first prompt would be:
Analyze this CSV. Summarize the most important campaign performance patterns, calculate conversion rate and return on ad spend, identify outliers, and suggest the best chart to show the result.
The follow-up questions should get more specific:
- "Which channel has the best conversion rate after accounting for spend?"
- "Which campaign has high clicks but weak revenue?"
- "Create a line chart showing revenue by date."
- "What are the top three recommendations from this data?"
- "What assumptions could make this answer wrong?"
The important part is that each prompt names the metric, grouping, and output. "Analyze my campaign data" is a start. "Calculate ROAS by channel and explain which channel deserves more budget" is much better.
Prompt Templates For CSV Analysis
Use these templates when you do not know how to phrase the question:
| Goal | Prompt template |
|---|---|
| Dataset overview | "Summarize this CSV. Explain the columns, row count, data types, and most important patterns." |
| Trend analysis | "Show how [metric] changes over [date column]. Identify peaks, dips, and possible seasonality." |
| Segment comparison | "Compare [metric] by [category]. Rank the top and bottom groups and explain the difference." |
| Outlier detection | "Find rows where [metric] is unusually high or low. Explain whether each outlier might be an error or a real event." |
| Correlation check | "Check whether [metric A] and [metric B] move together. Explain the limitation of correlation." |
| Chart request | "Recommend the best chart for this CSV and create it using the most relevant columns." |
| Executive summary | "Write a 5-bullet summary for a manager, including the most important caveat." |
These prompts work because they are specific without requiring you to know the exact statistical method. They tell the AI what kind of answer you need.
Validate The Answer Before Using It
AI can speed up analysis, but it does not remove the need to check important numbers. The validation step is especially important when the answer will affect budget, hiring, pricing, product changes, or customer communication.
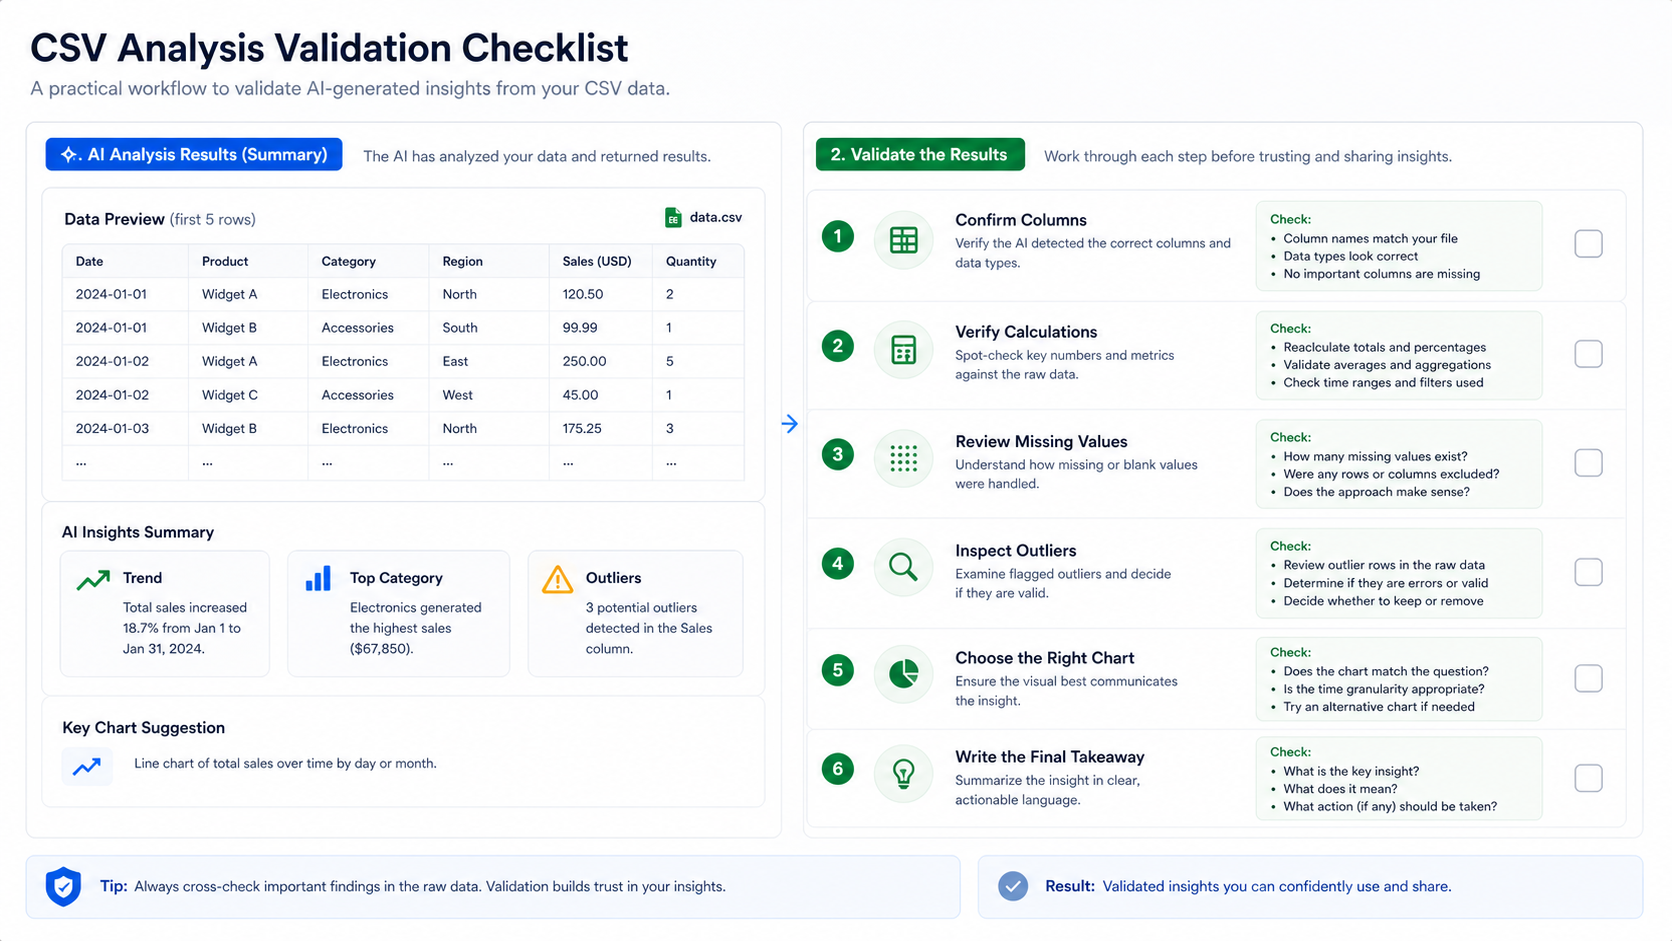
Use this checklist after the AI returns an answer:
| Validation check | What to do |
|---|---|
| Column meaning | Confirm that the AI understood each key column correctly. |
| Metric formula | Recalculate one or two important metrics manually. |
| Missing values | Ask whether blank or null values affected the answer. |
| Outliers | Inspect unusual rows before removing or acting on them. |
| Time range | Make sure the dates match the intended reporting period. |
| Chart mapping | Confirm the chart axes use the correct columns. |
| Caveats | Ask the AI what would make the conclusion unreliable. |
For chart-heavy work, move from the analysis answer into the AI data visualization tool. The same CSV can produce a summary, a bar chart, a trend line, and a written explanation.
Privacy Checks Before Uploading CSV Data
CSV files often contain customer names, emails, IDs, transaction notes, and internal financial details. Before using any AI tool, check whether the tool uploads the full file, stores it, logs prompts, or uses the content for training.
AnalyzeData parses files client-side in your browser. That means the raw file is read locally first, then the analysis request can use the schema and a bounded set of rows needed to answer the question. The workflow is designed to avoid storing uploaded files on an application server. For sensitive work, still remove columns that are not needed for the question.
For privacy-heavy datasets, use this checklist:
| Check | Why it matters |
|---|---|
| Remove direct identifiers | Names, emails, and IDs rarely help trend analysis. |
| Keep only needed columns | Fewer columns means lower exposure and cleaner analysis. |
| Aggregate when possible | Monthly or segment-level data is safer than row-level customer data. |
| Validate key numbers | AI output should be checked before business decisions. |
For broader privacy risk framing, the NIST Privacy Framework is a useful official reference when deciding what data should be minimized before analysis.
How This Fits With Other AI Data Analysis Tools
A general AI assistant can analyze CSV data too, especially when you want flexible reasoning, code, or methodology help. A purpose-built tool is usually better when the workflow starts with a file and the desired output is a summary, chart, or plain-English answer. For a broader comparison, see the best AI tools for data analysis comparison.
The best setup is not either-or. Use a focused workflow for fast CSV inspection and chart generation. Use a general assistant when you need to discuss methodology, write code, or explore a question that goes beyond the file.
Limitations
AI does not fix broken data automatically. If the CSV has missing headers, inconsistent date formats, mixed currencies, duplicate rows, or columns with unclear names, the analysis can be wrong or incomplete.
AI is also not a replacement for audit-grade statistics. Use it to explore, summarize, visualize, and generate hypotheses. For financial reporting, legal decisions, medical analysis, or regulated work, validate results with the source data and a qualified reviewer.
FAQ
Can AI analyze CSV files directly?
Yes. A purpose-built AI data analysis tool can read a CSV file, detect columns, summarize the dataset, calculate common statistics, and generate charts. AnalyzeData supports this workflow from the browser.
What should I ask first after uploading a CSV?
Start broad: "Analyze this CSV and summarize the key trends, statistics, outliers, and useful charts." Then ask narrower follow-up questions based on the first answer.
Is CSV better than Excel for AI analysis?
CSV is simpler and widely supported. Excel can hold multiple sheets, formulas, and formatting, but CSV is usually easier for quick row-and-column analysis.
Can AI create charts from CSV data?
Yes. After uploading the file, ask for a specific chart or ask the AI to recommend one. For chart-first work, use the AI data visualization tool.
What is the safest way to analyze CSV data with AI?
Remove unnecessary personal or sensitive columns, ask focused questions, and validate important numbers against the original file before acting on the result.
Ashesh Dhakal
Founder & Data Scientist
Ashesh Dhakal is a Data Science student at the University of Manitoba and a full-stack developer specializing in AI-powered applications. He holds a Computer Programming Diploma with Honors. His expertise spans explainable AI, natural language processing, and building production AI platforms.
Related Articles

How to Analyze Excel Data with AI Without Formulas
A practical guide to analyzing Excel data with AI, including workbook prep, spreadsheet prompts, trend analysis, chart questions, privacy checks, and limitations.

Privacy in AI Data Analysis: What To Check Before Uploading Data
Learn how to evaluate privacy in AI data analysis tools, including client-side parsing, sensitive columns, file retention, sampling, prompts, and safe workflows.

ChatGPT vs AI Data Analysis Tools: Which Should You Use?
Compare ChatGPT with purpose-built AI data analysis tools for CSV and Excel analysis, privacy, charts, speed, workflow fit, limitations, and accuracy checks.