
How to Analyze Excel Data with AI Without Formulas
A practical guide to analyzing Excel data with AI, including workbook prep, spreadsheet prompts, trend analysis, chart questions, privacy checks, and limitations.
Ashesh Dhakal
Published May 11, 2026 · Updated May 11, 2026
Excel is where a lot of real business data lives. People export data from CRM tools, ad platforms, finance systems, ecommerce platforms, surveys, and internal trackers, then clean and share it in spreadsheets. The problem is that analysis often gets stuck behind formulas, pivot tables, chart setup, and manual cleanup.
AI can help when you know what you want to understand but do not want to build the analysis manually. This guide shows a practical workflow for using AI to analyze Excel files. For the broader upload-and-ask workflow, use AnalyzeData to analyze data with AI; this article focuses on the workbook preparation, prompts, validation checks, and privacy decisions that make Excel analysis more reliable.
Prepare The Workbook First
AI works best when the spreadsheet structure is simple. Before uploading an Excel file, check the workbook for formatting that may confuse automated analysis.
| Workbook issue | Fix before analysis |
|---|---|
| Title rows above headers | Move notes out of the table or make the first row the header. |
| Merged cells | Unmerge cells so every row and column is machine-readable. |
| Multiple tables on one sheet | Split them into separate sheets or separate files. |
| Blank rows inside the table | Remove blank rows so the table stays continuous. |
| Hidden columns | Unhide or delete them so you know what is being analyzed. |
| Formula-only fields | Keep values clear enough that the AI can interpret the result. |
| Inconsistent date formats | Convert dates to one consistent format before asking trend questions. |
The ideal workbook has one dataset per sheet, clear column names, consistent dates, and one record per row. If your workbook has a summary tab plus raw data tabs, start with the raw data tab. Summary tabs can be helpful for context, but they can also hide how numbers were calculated.
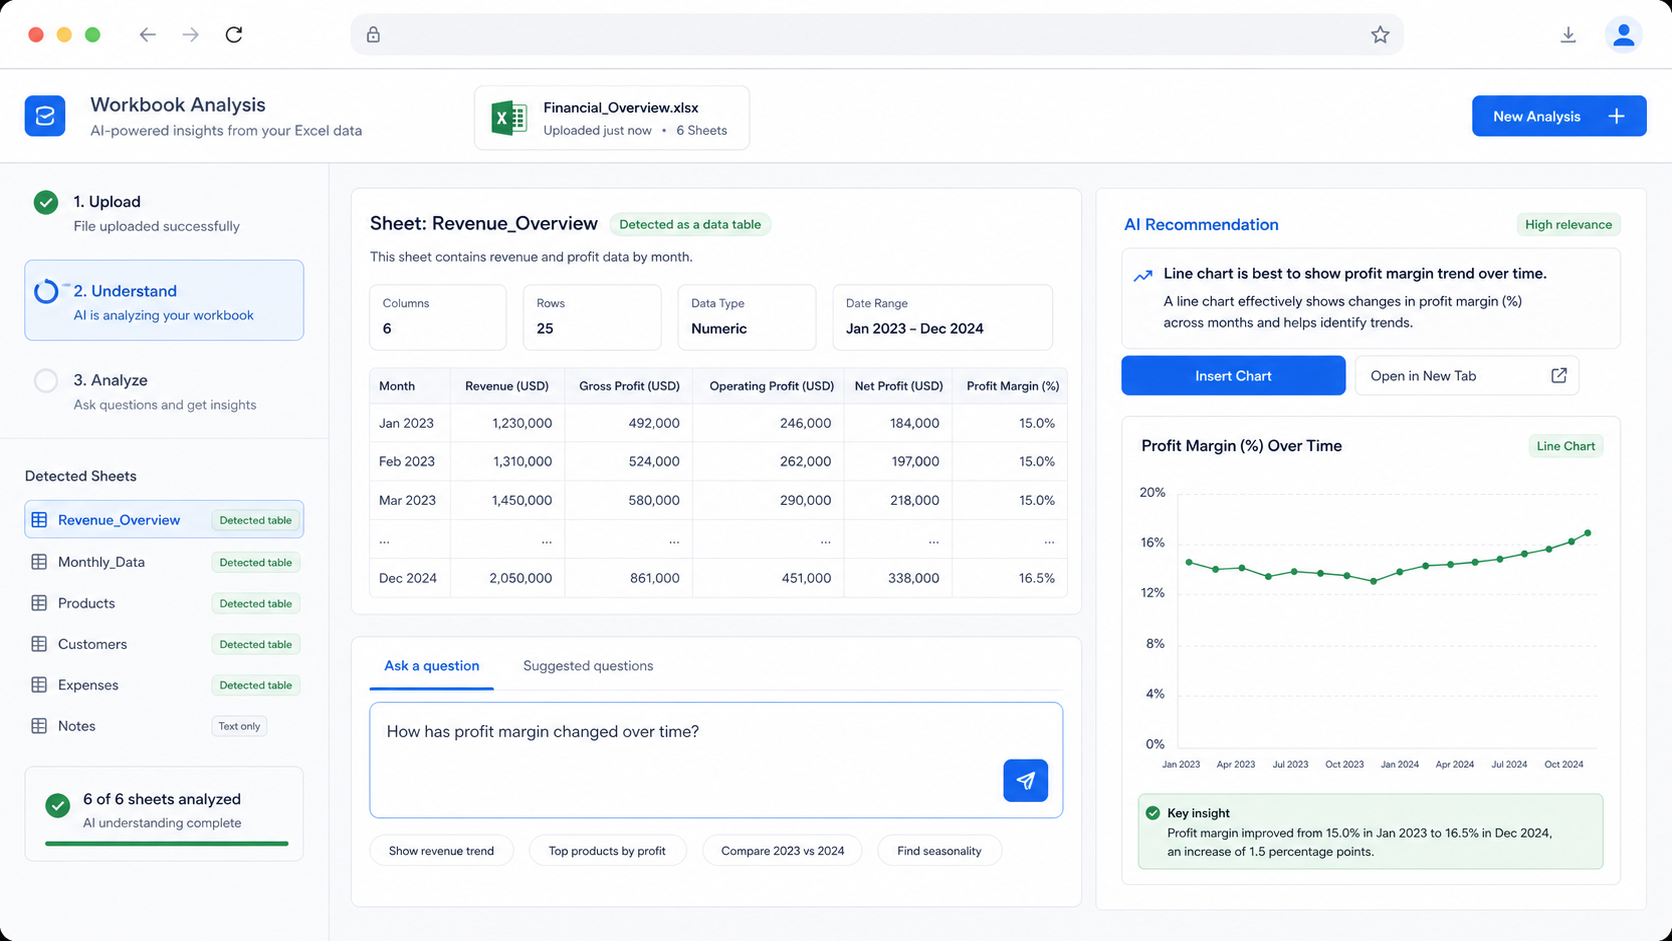
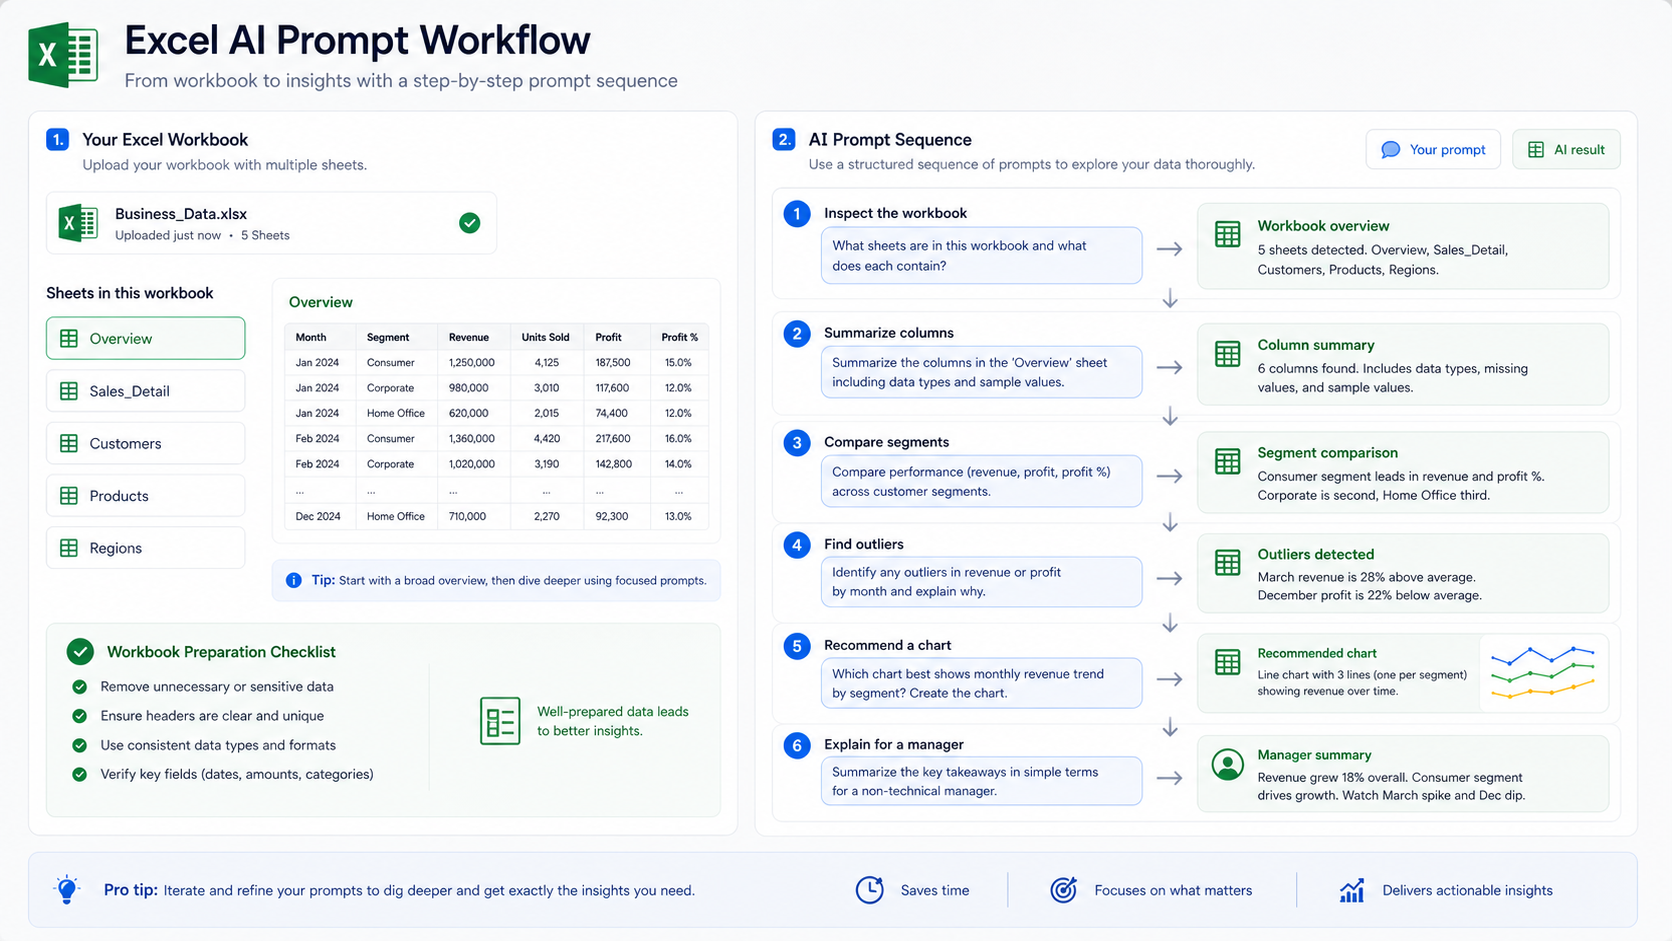
The First Prompt To Use
After uploading the workbook, ask a broad inspection question before asking for a final answer:
Analyze this Excel file. Identify each sheet, explain the key columns, summarize important trends, calculate useful statistics, find outliers, and recommend charts that would explain the data.
This first prompt forces the AI to inspect the workbook instead of guessing. Once you see the initial summary, ask follow-ups:
- "Which month had the biggest revenue change?"
- "Compare performance by region and product category."
- "Find rows that look like outliers."
- "Create a chart showing revenue trend by month."
- "Explain the result in plain English for a manager."
- "What should I verify before sharing this analysis?"
This pattern matches how people actually use spreadsheets: start with a broad overview, then narrow the question.
Example: Sales Workbook Analysis
Imagine an Excel workbook with three sheets:
| Sheet | Columns | Useful question |
|---|---|---|
| Orders | date, region, product, revenue, cost | "Which product-region combinations drive profit?" |
| Customers | customer_id, segment, signup_date | "Which customer segments produce the most repeat revenue?" |
| Campaigns | campaign, spend, clicks, conversions | "Which campaigns have the best revenue per dollar spent?" |
You can start with:
Summarize each sheet and tell me which columns are useful for revenue analysis. Then identify the strongest sales trends and create a chart recommendation.
Then ask:
Use the Orders sheet. Calculate revenue, cost, profit, and profit margin by region. Show the highest and lowest regions and explain possible reasons.
This gives the AI a clear scope. It also reduces the risk that it mixes sheets incorrectly. Multi-sheet workbooks are powerful, but they need explicit instructions. If you ask "what happened to revenue?" without naming the relevant sheet, the AI may infer the wrong table.
Excel AI Prompts That Usually Work
Use prompts that name the sheet, metric, grouping, and desired output.
| Goal | Prompt template |
|---|---|
| Summary | "Summarize the [sheet name] sheet and explain the main patterns." |
| Group comparison | "Compare [metric] by [category] and rank the top groups." |
| Trend analysis | "Show how [metric] changes over [date column]." |
| Outlier check | "Find rows where [metric] is unusually high or low." |
| Chart request | "Create a [chart type] showing [metric] by [dimension]." |
| Workbook audit | "Which sheets are useful for analysis and which should be ignored?" |
| Manager summary | "Explain the results in 5 bullets for a non-technical stakeholder." |
If you do not know the right chart type, ask the AI to choose one. For chart-heavy work, the AI data visualization tool is the better destination because it is focused on generating charts and graphs from data.
How To Ask About Formulas And Pivot Tables
AI can help you avoid formulas, but it can also explain formulas when you inherit a workbook. The key is to ask for interpretation before asking for a rewrite.
Good formula and pivot prompts include:
| Situation | Prompt |
|---|---|
| Formula-heavy workbook | "Explain what the calculated columns appear to measure and which raw columns they depend on." |
| Pivot table output | "Treat this pivot table as a summary. What question does it answer, and what raw data would be needed to verify it?" |
| Broken formula | "This column has missing or inconsistent values. What checks should I run before analyzing it?" |
| Manual reporting | "What repeatable analysis steps does this workbook appear to perform each month?" |
If the workbook contains only pivot-table output, the AI can summarize it, but it may not be able to validate the underlying calculation. If you have access to the raw data, analyze that instead.
Privacy And Sensitive Columns
Excel files often include private data because they are easy to share internally. Before using any AI workflow, remove columns that are not needed for the analysis, especially direct identifiers such as names, emails, phone numbers, account IDs, and notes.
AnalyzeData is designed around browser-based file parsing, which means the workbook is read locally before the analysis request is prepared. The request can still include schema and a bounded set of rows needed for the answer, so privacy is a workflow, not a slogan. The safest analysis is the one that uses only the columns required to answer the question.
If you use Microsoft 365 or another spreadsheet platform for sensitive work, review the vendor's current admin and data-handling controls before uploading regulated data. For general privacy planning, the NIST Privacy Framework is a useful official reference.
Validation Checklist For Excel AI Analysis
Excel workbooks can carry hidden assumptions. Before sharing an AI-generated answer, check the following:
| Check | Why it matters |
|---|---|
| Sheet scope | The AI may have summarized the wrong sheet or ignored a key tab. |
| Hidden filters | A filtered workbook can make totals look smaller than expected. |
| Date sorting | Month names and text dates can sort alphabetically instead of chronologically. |
| Formula outputs | Formula-generated columns may already contain assumptions. |
| Duplicates | Exported reports often duplicate orders, customers, or campaigns. |
| Blank values | Missing values can change averages, conversion rates, and rankings. |
For important decisions, ask the AI to show the exact calculation logic in plain English. Then spot-check the answer against the workbook.
Mini Workflows For Common Excel Files
The best prompt depends on the kind of workbook you have. A finance workbook, a sales workbook, and a survey workbook should not be analyzed the same way.
| Workbook type | First prompt | Useful follow-up |
|---|---|---|
| Sales pipeline | "Summarize pipeline value by stage, owner, and expected close month." | "Which stages have the largest drop-off and which owners need review?" |
| Ecommerce orders | "Analyze revenue, average order value, and repeat purchase patterns." | "Create a chart showing revenue by month and product category." |
| Marketing report | "Compare spend, clicks, conversions, and revenue by channel." | "Which channel has strong conversion but weak revenue?" |
| Survey responses | "Summarize ratings and group common free-text themes." | "Which themes appear most often among low-rating responses?" |
| Finance expense file | "Compare expense categories by month and flag unusual changes." | "Which categories increased the most compared with the prior period?" |
| Inventory workbook | "Identify low-stock, slow-moving, and high-value items." | "Which products should be reordered first based on stock and demand?" |
These prompts are intentionally specific. They tell the AI which metric matters, how the rows should be grouped, and what kind of output is useful. If the workbook has multiple sheets, add the sheet name to the prompt.
What AI Should Not Do With Excel
AI is useful for exploration, but it should not silently replace spreadsheet controls that matter to the business.
Do not let AI:
- Change formulas without explaining the impact.
- Treat filtered rows as the full dataset without checking.
- Combine sheets unless the join key is clear.
- Assume blank cells mean zero.
- Make tax, legal, payroll, or compliance decisions without review.
- Present a chart as final before the workbook numbers are verified.
For repeatable reporting, document the final prompt and the validation steps. That way the next person can reproduce the analysis instead of trusting a one-off answer.
Excel vs CSV For AI Analysis
Excel and CSV both work, but they fit different jobs.
| Format | Better for | Watch out for |
|---|---|---|
| Excel | Multi-sheet workbooks, business context, shared reporting files | Merged cells, hidden tabs, formulas, formatting noise |
| CSV | One clean table, exports, quick analysis, repeatable file uploads | No formulas, no multiple sheets, less context |
If your workbook has one clean table, CSV is often simpler. If the workbook has multiple related sheets, Excel keeps the context together. AnalyzeData supports both, so the practical decision is usually: keep Excel when the sheets matter, export CSV when you only need one table.
How This Fits With AI Data Analysis Tools
Excel analysis is one part of the broader AI data analysis workflow. Some people need a fast spreadsheet answer; others need a comparison of tools, privacy tradeoffs, and charting workflows. For that broader selection process, see the best AI tools for data analysis comparison.
Use a focused AI data analysis workflow when you want to upload the workbook and ask questions. Use a general AI assistant when you need help writing formulas, debugging spreadsheet logic, or discussing methodology outside the workbook.
Limitations
AI can misread messy spreadsheets. It can also miss business context that is not inside the file. If a column name is vague, such as "value" or "status", rename it before analysis.
Do not use AI output as the only source for regulated reporting, tax filing, legal decisions, medical analysis, or financial statements. Use it to speed up exploration, then verify important numbers in the workbook.
FAQ
Can AI analyze Excel files without converting to CSV?
Yes. AnalyzeData supports Excel files directly, so you can upload an .xlsx file and ask questions in plain English.
What is the best first question for Excel AI analysis?
Ask the AI to identify sheets, explain columns, summarize trends, calculate statistics, find outliers, and recommend useful charts.
Can AI replace pivot tables?
AI can answer many of the same exploratory questions that people use pivot tables for, but pivot tables are still useful for repeatable reporting and manual validation.
Is Excel or CSV better for AI data analysis?
Excel is better when the workbook has multiple sheets or business context. CSV is simpler for a single flat table. AnalyzeData supports both.
Can AI create charts from Excel data?
Yes. Ask for a chart in plain English, or ask the AI to recommend the best chart type for your spreadsheet.
Ashesh Dhakal
Founder & Data Scientist
Ashesh Dhakal is a Data Science student at the University of Manitoba and a full-stack developer specializing in AI-powered applications. He holds a Computer Programming Diploma with Honors. His expertise spans explainable AI, natural language processing, and building production AI platforms.
Related Articles

How to Analyze CSV Data with AI: Step-by-Step Guide
Learn how to analyze CSV data with AI using a practical workflow for summaries, trends, statistics, charts, privacy checks, and follow-up questions.

Privacy in AI Data Analysis: What To Check Before Uploading Data
Learn how to evaluate privacy in AI data analysis tools, including client-side parsing, sensitive columns, file retention, sampling, prompts, and safe workflows.

ChatGPT vs AI Data Analysis Tools: Which Should You Use?
Compare ChatGPT with purpose-built AI data analysis tools for CSV and Excel analysis, privacy, charts, speed, workflow fit, limitations, and accuracy checks.